The biggest contributors to emissions – explained
This is the second in a series of three articles. This first looked at the different sources of energy we use to power our grids. This one breaks down where emissions come from across our economy, and the final article will suggest ways we might be able to contribute to bringing emissions down.
We’re getting better at understanding where greenhouse gas (GHG) emissions come from, which means we have a pretty good idea which activities contribute the most, and where we can take actions to reduce emissions.
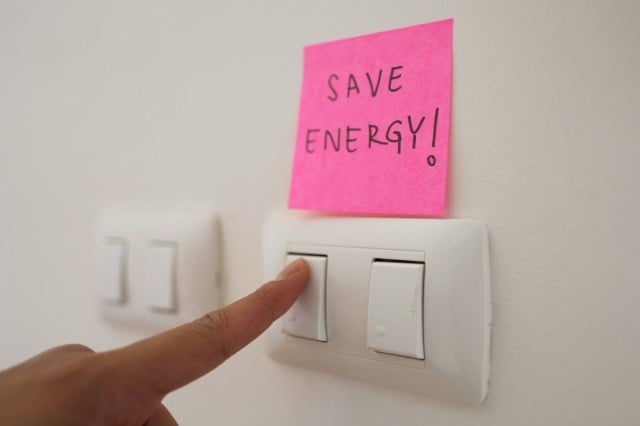
We know that using electricity from the grid in our homes and businesses contributes the most to emissions, both in Australia and globally1. The next biggest contributor to emissions is what’s called stationary energy – gas used in peoples’ houses and onsite generators in industries like mining. Transport including emissions from cars, trucks, domestic shipping and aviation is the next biggest contributor to emissions, followed by agriculture, fugitive emissions from fossil fuel mining and drilling, then industrial emissions like steel and concrete, and finally waste and land use.
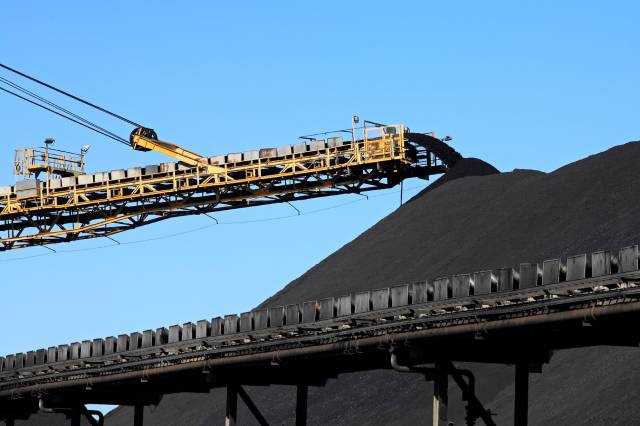
When we say emissions, we are talking mostly about carbon dioxide (CO2). These are the greenhouse gas emissions created by burning fossil fuels like coal and gas and account for close to 70% of the emissions in Australia in any given year, with methane and nitrous oxide accounting for most of the remaining 30%.2 Methane is associated with the land and waste sectors, while nitrous oxide comes mostly from fertilizers.
How are we tracking?
You may be aware 195 countries have signed up to the Paris Agreement, which aims to limit warming to between 1.5 and well below 2 degrees. As part of this agreement the countries set their own net zero commitments and interim targets. Australia has made some progress towards net zero emissions, but there’s still some way to go.3
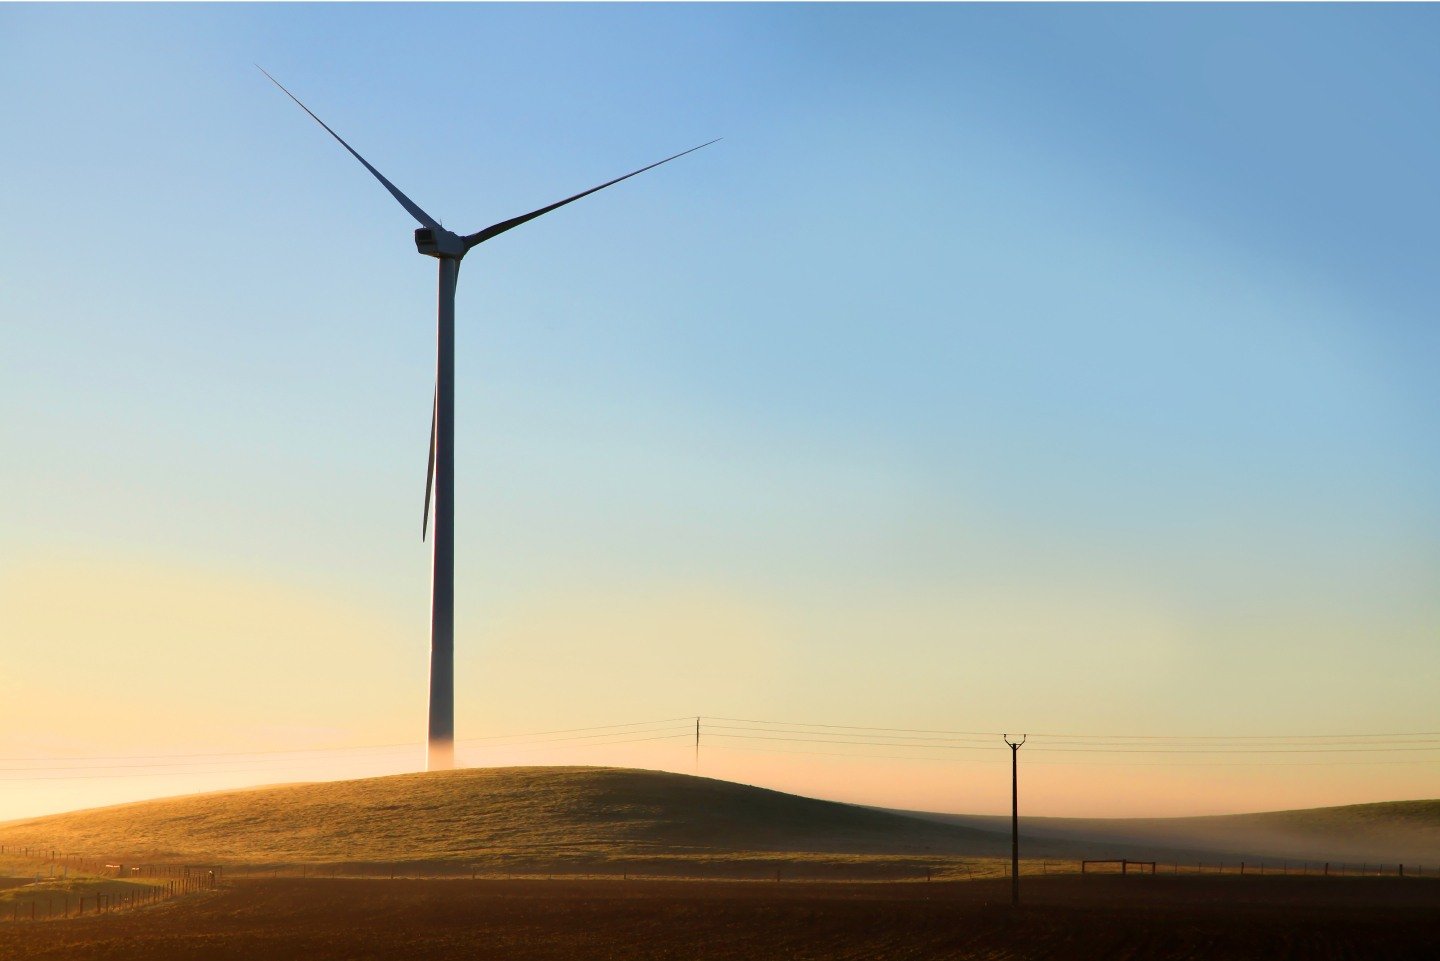
The Federal Government has set a renewables target of 82% by 2030. The Clean Energy Authority’s latest Annual Progress Report estimates we’re at around 32% of electricity powered by renewable energy.4
It may feel like getting from 32% to 82% renewable energy in just over 5 years is a bit of a stretch, but renewable energy generation is catching up – renewable energy as an input into the energy supply mix on electricity grids more than doubled in the seven years to 2015, and it continues to progress with every quarter. The latest quarter figures show we are pushing up towards over 40% energy generation from renewables.5

Transport and industry
So where are the biggest emissions reductions likely to come from in the next five years and beyond – in addition to the decarbonisation of the grid?
This is the question governments around the world are asking themselves. In fact, the Australian government will be coming out with sector plans this year for how each part of the economy can decarbonise in order to meet our commitments.
When we say sectors, we’re grouping the activities we segmented in the pie chart above.
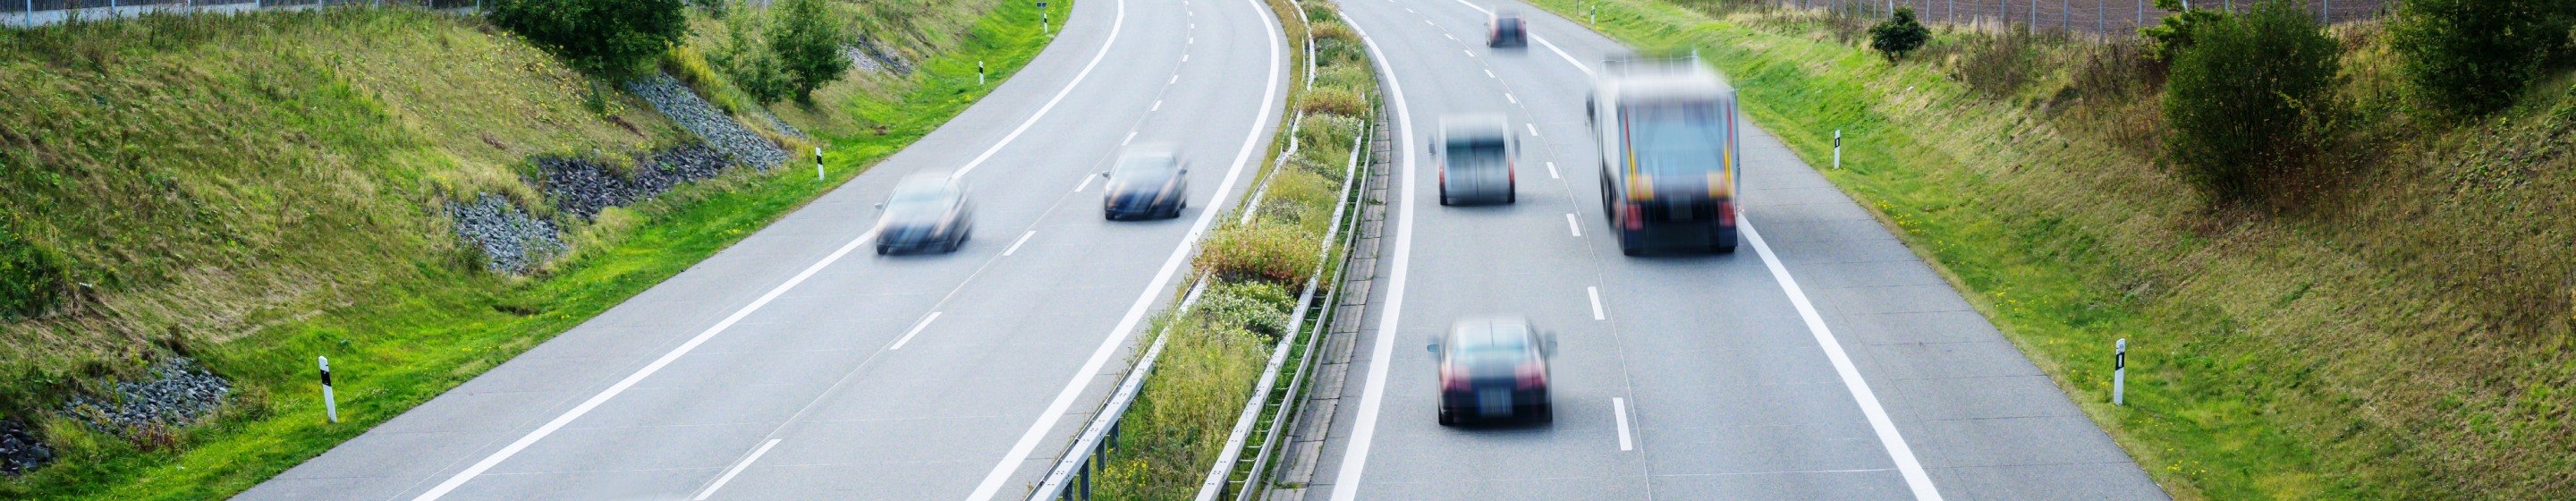
Transport is among the top contributors to emissions in Australia overall.
It may feel like getting from 32% to 82% renewable energy in just over 5 years is a bit of a stretch, but renewable energy generation is catching up – renewable energy as an input into the energy supply mix on electricity grids more than doubled in the seven years to 2015, and it continues to progress with every quarter
Another large contributor to emissions is what’s called industrial processes and product use, which includes emissions from the production of chemicals, metals and minerals, including in cement and steel manufacture.
While these areas might feel like they’re difficult for many of us to have much influence over, they’re a big focus of our stewardship efforts at Australian Ethical.
Future-focused portfolios
We have made addressing climate change a priority because we see it as a systematic threat to the continuing good health of people, planet and animals.
This means we are allocating capital and using our influence with companies and governments to accelerate the transition to net zero emissions. We do this not only because it creates better outcomes for the planet and its inhabitants, but because we see it as an urgent priority and critical to the financial best interests of those that invest with us.
Our investments in battery innovation and solar farms via our Infrastructure Debt Fund is one example of the way we are allocating capital to our new energy future and generating investment returns for our members and investors.
Because our ethical screening process considers climate performance, we also tend to invest more in climate solutions – our listed portfolios have 77% lower CO2 intensity compared to the mainstream fund comparisons6, and we have 4.6 times the investment in renewables and energy solutions.7
If you're interested in learning about our vision to create a better world where money is a force for good, read more.

^ This is general information only and does not take account of your individual investment objectives, financial situation or needs. Before acting on it, consider its appropriateness to your circumstances and read the Financial Services Guide (FSG), Product Disclosure Statement (PDS), and Target Market Determination (TMD) available on our website for information on the benefits and risks of our Funds. You should consider seeking advice from an authorised financial adviser before making an investment decision.
1 https://ourworldindata.org/emissions-by-sector
2 https://www.dcceew.gov.au/sites/default/files/documents/nggi-quarterly-update-sept-2023.pdf
3 Australia emitted 467 million tonnes (Mt) CO2-e in the year ending June 2023, which is 116 Mt CO2-e more than the level we need to reach by 2030 if we are to meet the Paris Agreement target of a 43% reduction below the level of emissions in 2005. To achieve the 2030 target, Australia will need to decarbonise at an average annual rate of 17 Mt CO2-e. P4 2023 Annual Progress Report (climatechangeauthority.gov.au)
5 https://www.aer.gov.au/industry/registers/resources/reviews/default-market-offer-2023-24
6 Compared to a blended sharemarket Benchmark of S&P ASX200 Index (for Australian and NZ shareholdings) and MSCI World ex Australia Index (for international shareholdings). Based on shareholdings at 30 June 2023 and analysis tools provided by external sources which cover 92% of the listed companies we hold shares in by value. See page 48 of our Sustainability Report for more information about this comparison. Carbon/CO2 e intensity of listed companies whose shares we invest in across our funds and options, measured as tonnes CO2 e per $ revenue. This should not be considered representative of individual funds or options which will have their own mix of share and other investments.
7 Based on the revenue from sustainable impact solutions earned by listed companies whose shares we invest in across our funds and options, and the proportion of those listed share investments in renewables and energy solutions. This should not be considered representative of individual funds or options which will have their own mix of share and other investments. For our analysis we use sustainable impact criteria and revenue data from external sources which aim to measure revenue exposure to sustainable impact solutions and support actionable thematic allocations in line with the U.N. Sustainable Development Goals (SDGs), EU Taxonomy of Sustainable Activities, and other sustainability related frameworks. More information available here. See page 48 of our Sustainability Report for more.